
info@mail.ucallm.com
1. Structure and Function of the Endoplasmic Reticulum
The endoplasmic reticulum (ER) is an essential membranous organelle in eukaryotic cells. It is composed of interconnected membranous tubules, flattened cisternae, and luminal compartments, forming a dynamic membrane network widely distributed throughout the cytoplasm. Based on the presence of ribosomes on its surface and its primary functions, the ER is generally classified into the rough endoplasmic reticulum (Rough ER) and the smooth endoplasmic reticulum (Smooth ER). The rough ER mainly participates in the synthesis, folding, and initial processing of secretory and membrane proteins, whereas the smooth ER is closely associated with lipid synthesis, calcium ion storage and release, and drug metabolism.
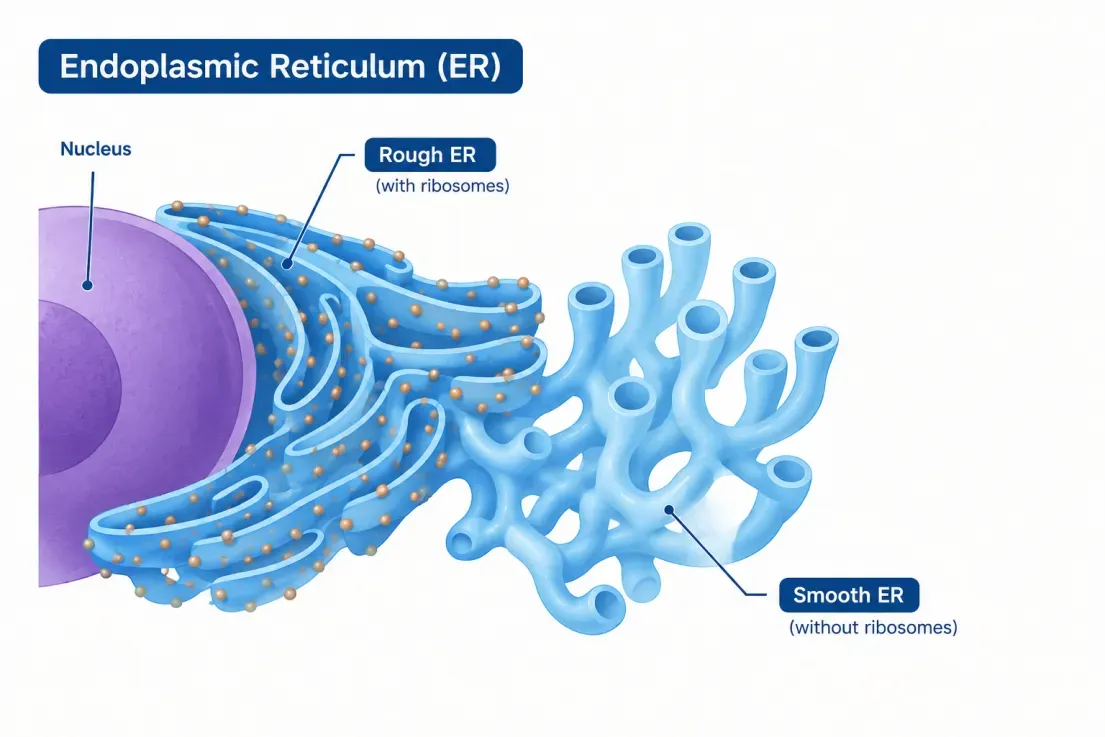
Figure 1. Structure of the endoplasmic reticulum (ER). The ER is a dynamic membrane network composed of rough ER studded with ribosomes and smooth ER lacking ribosomes. The ER network is closely associated with the nuclear envelope.
The endoplasmic reticulum is not a static intracellular structure but a dynamic system that continuously undergoes morphological remodeling, membrane trafficking, and functional regulation. Its structural integrity is closely linked to protein homeostasis, intracellular calcium signaling, lipid metabolism, and cellular stress responses. Through interactions with organelles such as the Golgi apparatus, mitochondria, and lipid droplets, the ER participates in cell growth, differentiation, energy metabolism, and cell-fate regulation. Therefore, research on the ER should not only focus on its morphology and distribution, but also integrate functional indicators, dynamic changes, and the spatial relationships among organelles for comprehensive analysis.
2. Key Biological Processes of the Endoplasmic Reticulum
2.1 Protein Synthesis and Folding
The endoplasmic reticulum is an important site for the synthesis, folding, and processing of secretory and membrane proteins. Nascent polypeptides carrying a signal peptide typically enter the ER lumen through the translocon channel on the ER membrane, or are inserted into the ER membrane during synthesis. Proteins that enter the ER complete correct folding, disulfide bond formation, and some post-translational modifications with the assistance of molecular chaperones and folding enzymes, and undergo rigorous quality control. Correctly folded proteins can be further transported to the Golgi apparatus for processing and sorting, whereas misfolded or immature proteins may be retained, refolded, or eliminated through ER-associated degradation pathways to maintain intracellular protein homeostasis.
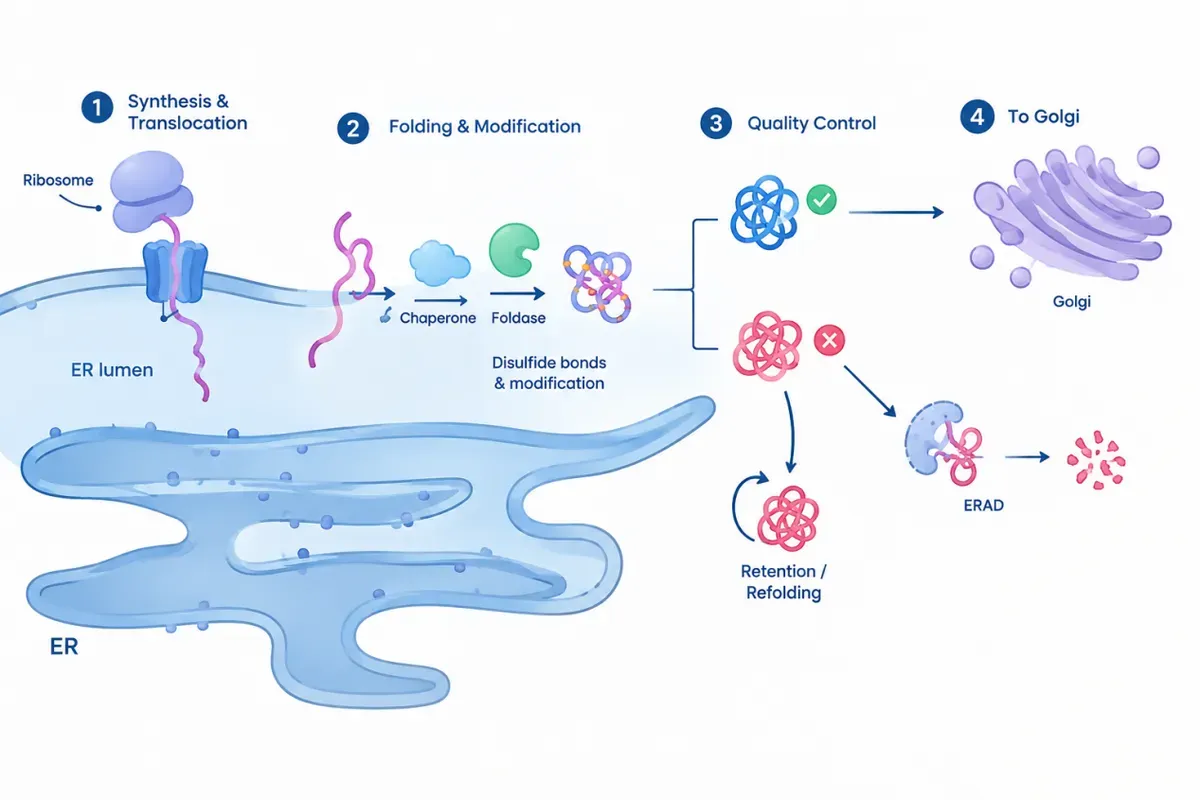
Figure 2. Protein synthesis, folding, and quality control in the endoplasmic reticulum (ER). Newly synthesized proteins enter the ER for folding and modification. Properly folded proteins are transported to the Golgi apparatus, while misfolded proteins undergo refolding or ER-associated degradation (ERAD).
Abnormalities in ER protein synthesis and folding are associated with various diseases and changes in cellular function. For example, tumor cells may face a higher protein synthesis burden under microenvironmental stress such as rapid proliferation and hypoxia; in neurodegenerative diseases, the accumulation of abnormal proteins may be related to disturbed ER protein homeostasis. Therefore, researchers can observe the morphology and distribution of the ER using ER-targeted fluorescent labeling, combine detection of ER-associated proteins such as Calnexin and PDI, and analyze the expression of molecular chaperones such as BiP/GRP78 to study the relationship between protein processing, folding quality control, and cellular stress.
2.2 ER Calcium Homeostasis
The endoplasmic reticulum is an important intracellular calcium storage site and plays a key role in maintaining cytosolic Ca²⁺ homeostasis and regulating cell signal transduction. SERCA (sarco/endoplasmic reticulum Ca²⁺-ATPase) on the ER membrane uses ATP to transport cytosolic Ca²⁺ back into the ER lumen, while calcium channels such as the IP₃ receptor (IP₃R) and the ryanodine receptor (RyR) mediate the release of ER calcium stores. Through the storage, release, and re-uptake of calcium, the ER regulates the amplitude, duration, and spatial distribution of intracellular Ca²⁺ signals, thereby influencing cell secretion, muscle contraction, metabolic regulation, gene expression, and cell death.
Disturbances in ER calcium homeostasis may alter cellular signal responses and are associated with the development of cardiovascular diseases, neurological disorders, tumors, and metabolic diseases. In experimental studies, researchers can use ER-targeted genetically encoded calcium indicators to monitor dynamic changes in Ca²⁺ within the ER lumen, and combine cytosolic calcium probes to analyze the relationship between ER calcium release and cytosolic calcium signals. For example, under drug stimulation or receptor activation, continuous fluorescence recording can be used to evaluate ER calcium store depletion, calcium release kinetics, and the recovery of calcium homeostasis. Compared with detecting calcium levels at a single time point, live-cell dynamic imaging is more helpful in resolving the time dependence and regulatory mechanisms of calcium signaling.
2.3 ER Stress and the Unfolded Protein Response
ER stress refers to a state in which the accumulation of unfolded or misfolded proteins in the ER, calcium homeostasis imbalance, or other cellular pressures causes its functional load to exceed its processing capacity. To cope with this change, cells initiate the unfolded protein response (UPR), which mainly involves three signaling pathways: PERK, IRE1, and ATF6. Upon activation, PERK can transiently reduce overall protein synthesis through eIF2α phosphorylation while promoting the expression of ATF4-related stress genes; IRE1 can mediate the splicing of XBP1 mRNA and enhance the expression of genes related to protein folding and ER functional regulation; ATF6, through proteolytic processing, generates a fragment with transcriptional regulatory activity that promotes the expression of molecular chaperones and other stress-related genes. Together, these mechanisms help cells restore protein homeostasis.
ER stress has both adaptive and detrimental aspects. Short-term, moderate stress usually helps cells adjust their protein synthesis and degradation capacity, whereas sustained or intense stress may trigger inflammation, metabolic disorders, cell cycle changes, and even apoptosis. In tumor research, ER stress may be involved in the adaptation of tumor cells to hypoxia, nutrient limitation, and drug treatment; in studies of neurodegenerative and metabolic diseases, it is commonly used to explore the link between disturbed protein homeostasis and cellular damage. Common research strategies include detecting indicators such as BiP/GRP78, CHOP, p-PERK, p-eIF2α, and XBP1s, combined with Western blot, qPCR, immunofluorescence, and cell viability assays to assess the activation status of stress pathways and their effects on cell fate. Notably, changes in a single marker are usually insufficient to determine the activity of the entire UPR pathway; multiple indicators and appropriate time points and treatment conditions should be analyzed together.
2.4 Lipid Synthesis and Membrane Homeostasis
The endoplasmic reticulum is an important site for cellular lipid synthesis and metabolism, participating in the synthesis, transformation, and distribution regulation of phospholipids, cholesterol, triglycerides, and various other lipids. These lipids are not only important components of the plasma membrane and organelle membranes, but also participate in membrane structure renewal, signal molecule generation, and energy storage. Neutral lipids synthesized in the ER can accumulate in specific membrane regions and participate in lipid droplet formation, while the lipid composition of the ER membrane itself can affect membrane fluidity, protein function, and organelle structure. The dynamic regulation of lipid synthesis and transport is an important basis for maintaining cell membrane homeostasis and normal metabolism.
Abnormal ER lipid metabolism is closely related to research directions such as fatty liver, obesity, insulin resistance, and tumor metabolic reprogramming. For example, enhanced lipid synthesis may change the number and distribution of intracellular lipid droplets, while excessive lipid accumulation may increase ER pressure and interact with ER stress. Researchers can combine lipid fluorescent probes such as BODIPY, ER marker dyes, and detection of lipid metabolism-related proteins to observe the spatial relationship between the ER network and lipid droplet formation, and to analyze changes in cellular lipid storage and distribution under different treatment conditions. To further dissect the mechanisms of lipid metabolism, lipidomics, metabolic flux analysis, and related gene expression detection can be combined to distinguish changes in different stages such as lipid synthesis, storage, and transport.
2.5 Organelle Crosstalk and Trafficking
In addition to its own synthetic and metabolic functions, the ER participates in intracellular material transport and homeostasis regulation by establishing spatial and functional connections with other organelles. Transport between the ER and the Golgi apparatus is an important part of the secretory pathway: proteins initially processed in the ER can be transported to the Golgi apparatus via COPII-coated vesicles for further glycosylation, sorting, and transport; some proteins are returned to the ER through corresponding retrieval mechanisms to maintain intracellular protein localization. Studying these processes helps to understand the molecular mechanisms of secretory protein processing, membrane protein trafficking, and abnormal intracellular protein localization.
The ER can also form ER–mitochondria contact sites with mitochondria, including the contact regions involving mitochondria-associated membranes (MAMs). These regions participate in Ca²⁺ transport, lipid exchange, mitochondrial metabolic regulation, and cell death signaling. For example, Ca²⁺ released by the ER can be taken up by adjacent mitochondria, thereby affecting mitochondrial metabolic activity; however, when calcium transport is excessive or persistently imbalanced, it may also lead to mitochondrial dysfunction. Contacts between the ER and lipid droplets participate in neutral lipid transport and lipid droplet growth, while connections with other membranous organelles also help maintain the dynamic balance of the intracellular membrane system.
In experimental studies, organelle crosstalk is usually investigated using double- or multi-label fluorescence imaging, combined with confocal microscopy, live-cell imaging, and related protein detection, to analyze the spatial distribution of the ER with mitochondria, Golgi apparatus, or lipid droplets and its changes under treatment conditions. For ER–mitochondria interactions, contact site-related proteins can be further detected, or more targeted contact site analysis methods can be applied to strengthen the evidence for organelle interactions.
3. Summary of ER Research Hotspots
| Research Direction | Research Hotspots | High-frequency Scientific Questions | Typical Application Scenarios | Innovative Entry Points Worth Attention |
|---|---|---|---|---|
| ER structure and dynamics | ER tubular and lamellar structures, network remodeling, membrane morphology regulation, ER dynamics | How is the ER network formed and reorganized? How do structural changes affect cellular function? | Live-cell imaging, cellular stress, organelle morphology research | Shift from static morphological observation to dynamic tracking; combine automated image analysis to quantitatively assess network structure and remodeling |
| Protein homeostasis and ER stress | Protein synthesis and folding, protein quality control, ERAD, unfolded protein response (UPR) | How are misfolded proteins recognized and cleared? How do cells choose between stress adaptation and death? | Tumor, drug toxicity, hypoxia, neurodegenerative diseases, protein homeostasis research | Jointly analyze PERK–eIF2α–ATF4, IRE1α–XBP1, and ATF6 pathways; dynamically correlate stress intensity, duration, and cell fate |
| ER calcium homeostasis and signaling | Ca²⁺ storage and release, SERCA, IP₃R, RyR, calcium signaling regulation | How does the ER calcium store respond to cellular stimuli? How does calcium homeostasis imbalance affect cell function and survival? | Neuroscience, muscle physiology, cellular stress, cell death | Use ER-targeted calcium indicators for live-cell imaging; simultaneously compare ER and mitochondrial Ca²⁺ dynamics |
| ER lipid metabolism and membrane homeostasis | Phospholipid and cholesterol metabolism, ether lipid synthesis, lipid droplet formation, lipid homeostasis regulation | How does the ER regulate membrane lipid composition? How do abnormal lipid metabolism affect organelle function? | Lipid metabolism, metabolic diseases, tumor, organelle biology | Combine lipidomics, lipid-responsive probes, and imaging to resolve the localization, dynamics, and function of specific lipids |
| ER protein trafficking and secretion | ER–Golgi transport, COPII/COPI, protein sorting, secretory pathway | How are proteins exported from the ER? Does stress affect protein maturation, trafficking, and secretion? | Secretory protein research, antibody production, protein expression, cellular function research | Track protein trafficking in real time and jointly analyze protein maturation, secretion efficiency, and cellular stress status |
4. ER Imaging Product Line
4.1 Antibodies
| Product Category | Target / Representative Product | Detection Target | Primary Applications |
|---|---|---|---|
| ER structural markers | Calnexin | ER membrane protein | ER localization, morphological labeling, organelle colocalization |
| Calreticulin | ER luminal calcium-binding protein | ER localization, calcium homeostasis and protein folding studies | |
| Protein folding and quality control | PDI/P4HB | ER luminal protein | Protein folding, ER redox studies |
| ERP72/PDIA4 | ER protein disulfide isomerase | Protein homeostasis and folding quality control | |
| GRP78/BiP/HSPA5 | ER molecular chaperone | ER stress and protein homeostasis | |
| GRP94/HSP90B1 | ER luminal molecular chaperone | ER stress, protein quality control | |
| ER stress and UPR signaling pathways | CHOP/GADD153/DDIT3 | Stress-related transcription factor | ER stress, apoptosis research |
| PERK/EIF2AK3 | UPR sensor protein | PERK pathway activation | |
| Phospho-eIF2α (Ser51) | Phosphorylated translation initiation regulatory protein | ISR/UPR signaling activation | |
| ATF4 | Stress-related transcription factor | Stress adaptation, cell fate research | |
| ATF6 | UPR sensor and transcriptional regulatory protein | ATF6 pathway analysis | |
| XBP1s | Spliced transcription factor | IRE1–XBP1 pathway, secretory cell stress | |
| ER calcium homeostasis and functional regulation | SERCA2/ATP2A2 | ER Ca²⁺-ATPase | ER calcium storage and homeostasis regulation |
| IP3R/ITPR1, ITPR2, ITPR3 | ER Ca²⁺ release channels | Calcium signaling and inter-organelle calcium transfer | |
| STIM1 | ER calcium-store-depletion sensor | Store-operated calcium entry (SOCE) research | |
| ORAI1 | Plasma membrane calcium channel protein | SOCE and cellular calcium signaling research |
4.2 ER Fluorescent Dyes and Localization Probes
| Representative Product | Core Principle | Detection Method | Primary Applications |
|---|---|---|---|
| Ucell® ER Green 504 Live-Cell Probe | BODIPY FL-glibenclamide probe; selective labeling through interaction with ER-related binding sites | Live-cell fluorescence microscopy; green channel | ER localization, morphological observation, network structure analysis |
| Ucell® ER Red 587 Live-Cell Probe | BODIPY TR-glibenclamide probe; selective labeling via ER-related binding sites | Live-cell fluorescence microscopy; red channel | ER morphological observation, red-channel colocalization imaging |
| Ucell® ER Blue-White 374 Live-Cell Probe | ER-selective fluorescent dye; provides a violet-blue excitation channel labeling option | Live-cell fluorescence microscopy | ER localization, multicolor organelle imaging |
| Ucell® ER-Select Green 488-495 Staining Kit | ER-selective green fluorescent dye labeling | Live-cell or detergent-permeabilized aldehyde-fixed cell fluorescence microscopy | ER morphology, localization, and colocalization with other fluorescent proteins |
| Ucell® ER-Select Red 580 Staining Kit | ER-selective red fluorescent dye labeling | Live-cell or detergent-permeabilized aldehyde-fixed cell fluorescence microscopy |
4.3 ER Fluorescent Protein Labeling Tools
| Catalog No. | Product Name | Targeting Structure | Fluorescent Label | Product Features | Primary Applications |
|---|---|---|---|---|---|
| WE9583 | Ucell® ER-CALR-mRFP Marker Plasmid | Endoplasmic reticulum | mRFP | CALR-related ER localization marker, red fluorescent label | ER localization and morphological observation; ER network distribution analysis; multicolor organelle imaging combined with other fluorescent labels |
| WE9608 | Ucell® ER-CALR-mBFP Marker Plasmid | Endoplasmic reticulum | mBFP | CALR-related ER localization marker, blue fluorescent label |
4.4 ER Calcium Imaging Probes
| Representative Product | Detection Target | Core Principle | Primary Applications |
|---|---|---|---|
| Ucell® ER Calcium Indicator 492 AM | ER Ca²⁺ changes | AM-ester low-affinity calcium indicator enters cells and is hydrolyzed by esterases; produces a fluorescence response upon binding Ca²⁺ | ER calcium storage and release, calcium homeostasis and calcium signaling dynamics monitoring |
| Ucell® ER Calcium Indicator 492 Potassium Salt | Potassium-salt calcium indicator requiring appropriate delivery into cells; cannot be directly regarded as a membrane-permeable AM-ester dye | ER calcium detection |
5. Product Introduction
5.1 ER Fluorescent Dyes and Localization Probes
5.1.1 Ucell® ER Green 504 Live-Cell Probe / Ucell® ER Red 587 Live-Cell Probe
Detection principle:
Ucell® ER Green 504 Live-Cell Probe and Ucell® ER Red 587 Live-Cell Probe are fluorescent ER-labeling probes mainly used for fluorescence microscopy imaging of the ER in live cells. The main difference between the two products lies in the fluorophore and detection channel: Green uses BODIPY FL and Red uses BODIPY TR, which can be selected according to the fluorescent labeling combination and microscope channel in the experiment.
Both probes are composed of a fluorescent dye and glibenclamide. Glibenclamide can bind to the sulfonylurea receptor (SUR) associated with ATP-sensitive potassium channels, and this type of receptor is distributed to a certain extent on the ER. After entering cells, the probes achieve ER enrichment through glibenclamide-related binding, and the BODIPY fluorophore provides a detectable signal.
It should be noted that this localization mechanism does not mean the probe has absolute ER specificity in all cells. The expression and distribution of related receptors may differ among cell types, resulting in non-ER signals; in addition, glibenclamide has pharmacological activity and may affect ER-related functions. Therefore, experiments involving changes in cellular function should include appropriate controls and verify whether the staining conditions affect the study endpoints.
Application scenarios:
① Research on fatty-acid-induced ER damage and protective effects. ER stress is closely related to fatty-acid-induced cellular damage. Using Ucell® ER Green 504 Live-Cell Probe / Ucell® ER Red 587 Live-Cell Probe to label the ER and combining with Hoechst 33342 nuclear staining provides a visualization approach for studies of fatty acid lipotoxicity, cellular damage, and screening of protective compounds.
② Research on nanomaterial-induced organelle damage. The combined action of nanomaterials and fatty acids may cause changes in organelle morphology and function. Combined with ER fluorescent labeling and confocal microscopy, the tubular network, fragmentation, and dispersion of the ER can be observed, providing a visualization basis for studies of nanomaterial cytotoxicity, biocompatibility, and ER damage.
③ Research on drug treatment and ER stress. ER stress is involved in tumor cell responses to drugs and cell-fate regulation. Using Ucell® ER Green 504 Live-Cell Probe / Ucell® ER Red 587 Live-Cell Probe to label the ER, combined with cell viability assays and other phenotypic analyses, enables comparison of ER morphology and fluorescence distribution before and after drug treatment, providing imaging support for studies of drug mechanisms of action and cellular stress responses.
④ Research on hepatic lipid metabolism and ER stress pathways. The ER participates in lipid synthesis, processing, and intracellular homeostasis regulation, and is closely related to hepatic lipid accumulation. Through ER fluorescence imaging to observe intracellular structural changes, combined with lipid metabolism and ER stress-related indicators, the link between ER stress and abnormal lipid metabolism can be investigated, providing a visualization approach for fatty liver and hepatocyte metabolism research.
⑤ Live-cell organelle labeling and high-resolution imaging research. The ER possesses a complex tubular network and membranous structures. Using fluorescent probes suitable for live cells to label the ER, combined with high-resolution fluorescence imaging, enables observation of the spatial distribution and fine structure of the ER within cells, providing technical support for live-cell organelle imaging, subcellular structure analysis, and organelle dynamics research.
Technical points:
| Item | Recommendation / Description |
|---|---|
| Recommended samples | Live cells; live-cell fluorescence microscopy is preferred |
| Staining conditions | Start at approximately 1 µM as the reference concentration; stain at 37°C for about 15–30 min; optimize conditions according to cell type |
| Post-staining treatment | Replace with fresh culture medium free of the probe before imaging to reduce background from free probe |
| Fluorescence channel | Green: approx. Ex/Em 504/511 nm; Red: approx. Ex/Em 587/615 nm. Adjust actual filter and laser settings according to equipment configuration |
| Storage | Store at −5 to −30°C protected from light |
| Key controls | Include an unstained control; add single-stain controls when necessary; for functional studies, verify whether the probe affects cell state |
Validated sample types:
The sample types validated in completed experiments are listed below. The applicability of this product is not limited to the listed samples; other sample types may also be applicable.
| Sample Type | Representative Sample / Model |
|---|---|
| Cell lines | HEK293T |
| NIH3T3 mouse embryonic fibroblasts | |
| COS-7 monkey kidney cells | |
| C2C12 mouse myoblasts | |
| HeLa |
5.1.2 Ucell® ER-Select Green 488-495 Staining Kit / Ucell® ER-Select Red 580 Staining Kit
Technical principle:
Ucell® ER-Select Green 488-495 Staining Kit / Ucell® ER-Select Red 580 Staining Kit use ER-selective fluorescent dyes to label the ER within cells. The dyes can be used in live cells and in aldehyde-fixed, detergent-permeabilized cells, thereby compatible with both live-cell fluorescence observation and fixed-cell immunofluorescence analysis.
The fluorescence emission of the Green version is located in the FITC green channel, suitable for co-imaging with target proteins labeled with red or orange fluorescent proteins; the Red version has excitation/emission wavelengths of 580/677 nm, with emission located in the Texas Red region, suitable for co-imaging with target proteins labeled with green fluorescent proteins such as GFP. By observing the spatial distribution of the ER dye and target proteins, it can be assessed whether the target protein is localized to ER-related regions.
Application scenarios:
① Research on organelle crosstalk and phagocytosis. During phagocytosis, cells need to coordinate membrane trafficking and material exchange between phagosomes and organelles such as the ER and lysosomes. Using Ucell® ER-Select Green 488-495 Staining Kit / Ucell® ER-Select Red 580 Staining Kit to label the ER, combined with lysosomal staining and confocal microscopy, the spatial distribution and dynamic changes of organelles during phagocytosis can be observed, providing a visualization approach for studies of phagosome maturation, intracellular membrane system remodeling, and inter-organelle communication.
② Research on lipid metabolism and cellular uptake. Macrophages can take up lipid particles rich in triglycerides and participate in lipid metabolism through intracellular transport and lipid processing. Using Ucell® ER-Select Green 488-495 Staining Kit / Ucell® ER-Select Red 580 Staining Kit to label the ER, combined with lipid emulsion uptake experiments, enables study of caveolae-mediated endocytosis of particles by macrophages and the subsequent processing of internalized triglycerides.
③ Research on virus replication and ER–Golgi transport. The ER and Golgi apparatus jointly participate in the synthesis, processing, and transport of viral proteins. Viral infection may alter ER membrane structure and intracellular membrane transport. Suitable for studies of viral protein localization, intracellular membrane system remodeling, and virus replication mechanisms.
④ Research on protein subcellular localization and tumor cells. The spatial relationship between target proteins and the ER can provide clues for studies of protein processing, membrane protein transport, and cell signaling regulation. Using Ucell® ER-Select Green 488-495 Staining Kit / Ucell® ER-Select Red 580 Staining Kit to label the ER, combined with fluorescent protein fusion expression or immunofluorescence detection, enables comparison of the distribution of target proteins and ER marker signals.
Validated sample types:
The sample types validated in completed experiments are listed below. The applicability of this product is not limited to the listed samples; other sample types may also be applicable.
| Sample Type | Representative Sample / Model |
|---|---|
| Cell line | Human corneal epithelial cells (HCE) |
| Primary immune cells | Pacific oyster hemocytes (Crassostrea gigas hemocytes) |
| Cell line | Macrophage model |
| Cell line | Influenza virus infection-related cell models |
| Tumor cell line | Human tongue squamous cell carcinoma cells HSC-3, HSC-4 |
5.1.3 Ucell® ER Blue-White 374 Live-Cell Probe
Technical principle
Ucell® ER Blue-White 374 Live-Cell Probe is a fluorescent dye that can enter live cells and selectively label the ER, and can be used to observe the distribution and morphology of the ER within cells. This probe belongs to the Dapoxyl (DPX) dye family, featuring a large Stokes shift and good photostability, making it suitable for live-cell fluorescence microscopy.
An important feature of this probe is that its fluorescence signal is sensitive to the local environment: when the polarity of the surrounding solvent changes, both the position of its fluorescence emission peak and its fluorescence quantum yield change. Therefore, the dye emission is not limited to a single narrow band, but presents a signal within approximately 430–640 nm, the specific manifestation of which is affected by the probe environment.
Application scenarios:
Research on ER stress and tumor cell death. In studies of tumor cell stress and death mechanisms, Ucell® ER Blue-White 374 Live-Cell Probe can be used to detect ER-related fluorescence signals within cells, combined with flow cytometry, confocal microscopy, and protein expression analysis, to study drug-induced ER stress responses.
Research on drug-induced organelle changes and cell death mechanisms. When studying the mechanism of action of natural products and candidate compounds, Ucell® ER Blue-White 374 Live-Cell Probe can be used in combination with mitochondrial and lysosomal probes to observe the spatial distribution of different organelles via live-cell confocal imaging. Analyzing the spatial association of candidate compounds with different organelles provides imaging evidence for studies of compound mechanisms of action.
Research on ER morphology and membrane protein trafficking. The morphological organization of the ER is closely related to membrane protein trafficking. Using Ucell® ER Blue-White 374 Live-Cell Probe to label ER tubules in live cells, combined with fluorescently labeled antibodies to observe the intracellular distribution of related proteins, can be used for ER tubule visualization as well as studies of ER structure and membrane protein trafficking mechanisms.
Research on plant cell ER dynamics and environmental stress. Applied to ER imaging in plant cells. Using this dye to label the ER in root cells, combined with drug treatment, enables study of the subcellular distribution of membrane proteins and the dynamic changes of the intracellular membrane system under abiotic stress conditions.
Research on ER localization and subcellular lipid imaging. In studies of subcellular lipid distribution, Ucell® ER Blue-White 374 Live-Cell Probe can not only be used for ER localization under fluorescence microscopy, but also serve as an auxiliary localization tool for mass spectrometry imaging.
Research on neuronal ER distribution and damage. In studies of sensory neuron damage, Ucell® ER Blue-White 374 Live-Cell Probe is used to label the ER in freshly cultured live neurons, observing the distribution of the ER in the cytoplasm via microscopy, and further combined with immunocytochemical analysis of the calcium-binding protein calreticulin to study intracellular calcium storage changes related to nerve damage.
Technical points:
| Technical Feature | Specific Description |
|---|---|
| Live-cell ER-selective labeling | The probe can enter live cells and fluorescently label the ER, suitable for microscopic observation of ER distribution, morphology, and organelle spatial organization. |
| Environment-sensitive emission spectrum | Emission range approx. 430–640 nm; the fluorescence emission peak shifts with local microenvironment. For quantitative imaging, standardize staining, excitation, exposure, and detection conditions, and avoid directly equating fluorescence intensity changes with ER content changes. |
| Suitable for UV-excitation imaging systems | Excitation wavelength approx. 374 nm; recommended DAPI or UV long-pass detection configuration. Confirm the microscope has appropriate UV excitation capability and detection filters before use. |
| Supports multicolor organelle imaging | Can be combined with mitochondrial and lysosomal probes to study the spatial distribution of different organelles and morphological changes under treatment conditions. Verify channel compatibility in advance, especially noting its broad emission range. |
Validated sample types:
The sample types validated in completed experiments are listed below. The applicability of this product is not limited to the listed samples; other sample types may also be applicable.
| Sample Type | Representative Sample / Model |
|---|---|
| Tumor cell line | MDA-MB-231 human breast cancer cells |
| Colorectal cancer cell line | Colorectal cancer cell models such as HCT116 and HT-29 |
| Airway smooth muscle cells | Human airway smooth muscle cells |
| Neuron culture model | Sensory neurons isolated and cultured from rat dorsal root ganglia |
| Smooth muscle cells | Rat dartos smooth muscle cells |
| Plant seedling tissue | Roots, hypocotyls, and cotyledons of Arabidopsis seedlings |
| Fungal cells | Germlings of Aspergillus fumigatus |
5.2 ER Calcium Imaging Probes
5.2.1 Ucell® ER Calcium Indicator 492 AM
Technical principle:
Ucell® ER Calcium Indicator 492 AM is a low-affinity, membrane-permeable fluorescent calcium indicator specifically designed to monitor Ca²⁺ changes in the endoplasmic reticulum (ER). The AM ester group helps the probe enter live cells, after which it is hydrolyzed by intracellular esterases to form a charged active indicator that is retained within the cell. The indicator produces a fluorescence response upon binding Ca²⁺, and dynamic ER Ca²⁺ can be monitored by continuously collecting changes in green fluorescence intensity. Its low-affinity design is suitable for the relatively high Ca²⁺ concentration environment of the ER and also helps record rapid Ca²⁺ signal changes.
Application scenarios:
Monitoring ER Ca²⁺ stores and dynamic changes. Ucell® ER Calcium Indicator 492 AM can be used to observe changes in ER-related Ca²⁺ fluorescence signals in live cells, helping researchers analyze calcium signal responses under different stimuli or treatment conditions. Combined with ER colocalization markers and appropriate experimental controls, it can be used to evaluate changes in ER Ca²⁺ homeostasis and its role in cellular functional regulation.
Research on cellular metabolic stress and inter-organelle calcium signaling. In metabolic stress models such as lipid overload, Ucell® ER Calcium Indicator 492 AM can be used to detect ER-related Ca²⁺ fluorescence changes in hepatocytes, and combined with mitochondrial calcium detection, organelle colocalization, and molecular biology analysis, to explore the link between ER–mitochondrial calcium signaling crosstalk and mitochondrial dysfunction.
Analysis of stimulus-induced calcium signal responses. By recording fluorescence changes before and after stimulation, Ucell® ER Calcium Indicator 492 AM can be used to observe Ca²⁺ responses related to cellular stimulation, and to provide an imaging readout for studies of cell signaling pathways and calcium homeostasis regulation.
Technical points:
| Technical Feature | Specific Description |
|---|---|
| Live-cell ER Ca²⁺ dynamic detection | Ucell® ER Calcium Indicator 492 AM is a low-affinity fluorescent probe for ER calcium detection; it can monitor live-cell ER Ca²⁺ signal changes and is suitable for studying calcium release and rapid dynamic processes. |
| AM ester-mediated cell loading | The probe is membrane-permeable and can enter live cells, functioning as a calcium indicator after hydrolysis by intracellular esterases. Recommended loading concentration is usually 10–20 µM; the exact concentration and incubation time should be optimized according to cell type. |
| Suitable for rapid Ca²⁺ signal detection | The low Ca²⁺ affinity design helps detect large-amplitude or rapidly changing calcium signals, and can be used to analyze fluorescence responses and calcium signal kinetics before and after stimulation. |
| Compatible with conventional green fluorescence imaging systems | Excitation wavelength approx. 492 nm and emission approx. 515 nm; FITC/GFP channels can be used for fluorescence microscopy. |
| Supports ER colocalization verification | Can be used together with red fluorescent ER marker probes to observe the spatial correspondence between probe signals and ER regions through different fluorescence channels. Before multicolor imaging, confirm channel compatibility and set appropriate single-stain controls. |
| Suitable for ER calcium homeostasis research | Can be used to study ER Ca²⁺ changes induced by cellular stimulation, and to help analyze ER stress, inter-organelle calcium transfer, and related cellular functional changes. The probe reflects fluorescence responses; to obtain absolute Ca²⁺ concentrations, an appropriate calibration method must be established separately. |
| Optimization of staining and signal retention conditions | Recommended incubation at 37°C for about 2–3 hours. |
| Storage protected from light at low temperature | The product should be stored frozen below −15°C and protected from light as much as possible. During preparation and use, minimize repeated freeze-thaw cycles and optimize the working solution and loading process according to specific experimental conditions. |
Validated sample types:
The sample types validated in completed experiments are listed below. The applicability of this product is not limited to the listed samples; other sample types may also be applicable.
| Sample Type | Representative Sample / Model |
|---|---|
| Mouse hepatocytes | AML12 cells |
| Fish hepatocytes | ASL black sea bream hepatocytes |
| Oocyte model | Mouse oocytes and related human reproductive research models |
| Lens epithelial cell model | Lens epithelial cell models in research on high-myopia-related cataracts |
5.2.2 Ucell® ER Calcium Indicator 492 Potassium Salt
Detection principle:
Ucell® ER Calcium Indicator 492 Potassium Salt is a low-affinity fluorescent calcium indicator for ER Ca²⁺ dynamic detection. The probe produces a corresponding fluorescence response upon binding Ca²⁺, and can be used to monitor changes in intracellular calcium signals, making it suitable for studying ER calcium storage, calcium release, and calcium homeostasis regulation. As a potassium-salt form, Ucell® ER Calcium Indicator 492 Potassium Salt is not membrane-permeable and usually requires an appropriate intracellular delivery method to exert its detection function within cells.
Application scenarios:
ER Ca²⁺ dynamic detection. The ER is an important intracellular calcium storage site, and the release and re-uptake of its Ca²⁺ participate in the regulation of various cellular signals. Ucell® ER Calcium Indicator 492 Potassium Salt is a low-affinity calcium fluorescent indicator that can be used for ER calcium signal research under appropriate delivery conditions, helping to analyze dynamic changes in Ca²⁺ signals before and after experimental stimulation.
Intracellular calcium homeostasis research. Intracellular Ca²⁺ homeostasis is closely related to various physiological activities. By using Ucell® ER Calcium Indicator 492 Potassium Salt in an appropriate intracellular delivery system, changes in ER calcium storage and release can be explored, assisting in the study of intracellular calcium signaling regulatory mechanisms.
ER stress and cellular function research. Imbalance of ER calcium homeostasis is associated with ER stress responses and cellular dysfunction. This probe can serve as a calcium signal detection tool in specific experimental systems to study ER Ca²⁺ changes under different treatment conditions and further explore its connection with cellular stress responses.
Calcium signal kinetics and detection method development. Ucell® ER Calcium Indicator 492 Potassium Salt has low Ca²⁺ affinity, including rapid calcium signal detection and calcium current kinetics measurement. For laboratories with conditions for intracellular delivery, rapid fluorescence acquisition, or specialized calcium measurements, it can be used to establish and optimize related detection workflows.
Technical points:
| Technical Feature | Specific Description |
|---|---|
| Low-affinity Ca²⁺ indicator characteristics | Designed specifically for ER Ca²⁺ detection; the low-affinity characteristic is suitable for studying large-amplitude or rapidly changing calcium signals and can be used to analyze dynamic changes in intracellular calcium. |
| Non-membrane-permeable potassium-salt form | Does not possess membrane permeability and usually requires an appropriate intracellular delivery method. |
| Suitable for fluorescence imaging detection | Can be detected with reference to the green fluorescence channel. |
| Optimization of intracellular delivery conditions | The delivery method, probe concentration, and treatment time may affect cell viability, probe distribution, and calcium signals; pre-experiment optimization should be performed with the specific cell model. |
| Verification of ER localization and detection specificity | It is recommended to perform colocalization verification with ER markers and set appropriate background and calcium signal controls to avoid directly interpreting non-specific fluorescence changes as ER Ca²⁺ changes. |
| Suitable for relative calcium signal analysis | Can be used to compare fluorescence responses between different treatment groups or before and after stimulation. To determine absolute Ca²⁺ concentrations, an appropriate calibration system must be established; fluorescence intensity cannot be directly converted. |
| Storage protected from light at low temperature | Minimize the effects of light, repeated freeze-thaw cycles, and prolonged storage of working solutions on probe performance. |
5.3 ER Fluorescent Protein Labeling Tools
5.3.1 Ucell® ER-CALR-mRFP Marker Plasmid / Ucell® ER-CALR-mBFP Marker Plasmid
CALR (Calreticulin) is a calcium-binding molecular chaperone mainly localized in the ER lumen, participating in protein folding, glycoprotein quality control, and intracellular calcium homeostasis regulation. Fluorescent marker plasmids constructed based on CALR-related sequences can provide intuitive fluorescence imaging signals for ER-related structures. We provide a CALR (ETS)-related red fluorescent marker plasmid (Ucell® ER-CALR-mRFP Marker Plasmid, WE9583) and a blue fluorescent marker plasmid (Ucell® ER-CALR-mBFP Marker Plasmid, WE9608), offering different channel labeling options for observation of intracellular distribution, morphological analysis, and multicolor fluorescence imaging of ER-related structures.
Application scenarios:
ER morphology and dynamics research. Using CALR (ETS) fluorescent marker plasmids, the distribution and morphological changes of ER-related structures within cells can be observed. Combined with live-cell fluorescence microscopy, ER network rearrangement under different cell states, drug treatments, or stimuli can be compared, providing visualization support for morphological research on the intracellular membrane system.
Organelle colocalization and spatial organization analysis. Combining CALR ER markers with organelle markers for mitochondria, Golgi apparatus, or lysosomes enables comparison of the spatial distribution and signal overlap of different organelles through multicolor fluorescence imaging.
Morphological analysis related to ER stress. In ER stress-related experiments, CALR fluorescent labeling can be used to observe changes in ER morphology and distribution, and combined with detection of stress pathway markers, to comprehensively analyze the relationship between cellular structural changes and stress responses.
Multicolor fluorescence imaging schemes. Ucell® ER-CALR-mRFP Marker Plasmid / Ucell® ER-CALR-mBFP Marker Plasmid provide red and blue fluorescent labeling options, respectively. The appropriate channel can be selected based on other fluorescent labels in the experiment and the configuration of the microscopy imaging system, for combined observation of the ER and other cellular structures.
Data display:
Related products: in vitro transfection reagents.